Carbon in the atmosphere acts like a thermostat. It is the atmospheric level of carbon that primarily determines the temperature to which the planet will eventually heat. When humans burn plants, we put the carbon those plants drew from the air, to build their leaves and trunks, back into the atmosphere. In the chemical reaction of burning, two oxygen atoms glom onto one carbon atom, forming carbon dioxide. CO2 represents 75% of heat trapping emissions; methane and nitrous oxide make up most of the rest. These greenhouse gasses trap heat near the Earth surface instead of letting it escape into space. This extra heat warms the air and land and oceans
The lions share of greenhouse gas emissions today including 86% of the carbon emitted over the last decade, is created by our burning of ancient plants. This fossil carbon is the 300 million year old remnants of lush swamps, forests and seabeds, transformed by heat and pressure from the earth into fossil fuels like coal, oil and gas.
Currently, nature cleans up a bit over half of humanity’s carbon mess for free. A bit more than a quarter becomes plant food for photosynthesis on land, and a bit less than quarter is taken up by our oceans. This balance will change.
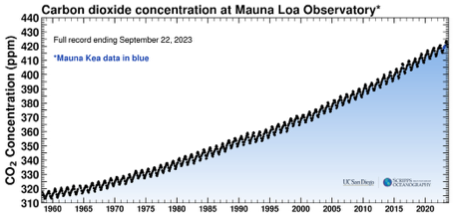
Carbon in the atmosphere is (now famously) measured by the Keeling Curve, begun in 1958. Then it was 320 ppm. In 2019 it surpassed 400, rising about 2.3ppm per year.
Paris and Policies
In the historic 2015 Paris agreement the nations of the world agreed to hold the increase in global average temperatures limit to 1.5 (‘One point five to stay alive’)
Existing policies are expected to lead to warming of about 3.5 C by 2100. The average human would experience more than twice as much warming because people live on land which warms much faster than oceans. The last time the planet was 3C warmer was at least 3 million years ago, when camels roamed north of the Arctic circle.
If the average age we live to is 80, what temperature will the earth be by the time you die?
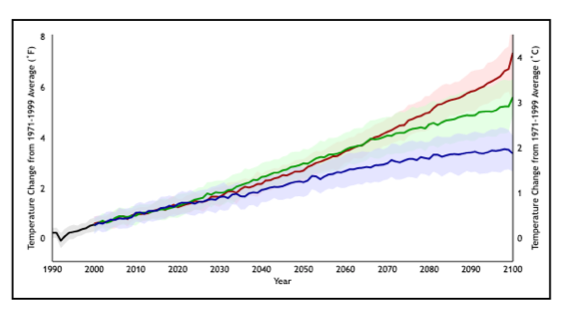
Graph of future climate projections based on different human emission pathways. The graph shows the average of a set of temperature simulations for the 20th century (black line), followed by projected temperatures for the 21st century based on a range of emissions scenarios (colored lines). The shaded areas around each line indicate the statistical spread (one standard deviation) provided by individual model runs. (Data processing by Jay Hnilo, CICS-NC, using data courtesy the Coupled Model Intercomparison Project, or CMIP3.)
The Gap
Why is the gap between the rhetoric and reality so large
Politics – societies grappling with transition away from the model based on fossil fuels but they are in politics for a short time, and stay in power
Money – who pays, this generation or next? which landmass? Is it the rich who have got rich off the back of fossil fuels.
How are we doing ?
Emissions are rising. Need to limit global warming keep warming to 1.5C.
We need to slash by emisions by 45% by end of decade
Looks like they will rise by 10%
What pledge, what worked and why
Rethinking Climate Change – Radio 4